本文实例为大家分享了vue实现3D环形图效果的具体代码,供大家参考,具体内容如下
1.引入highcharts
2.main.js引入highcharts
import highcharts from 'highcharts'
import highcharts3d from 'highcharts/highcharts-3d'
highcharts3d(highcharts)
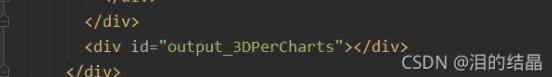
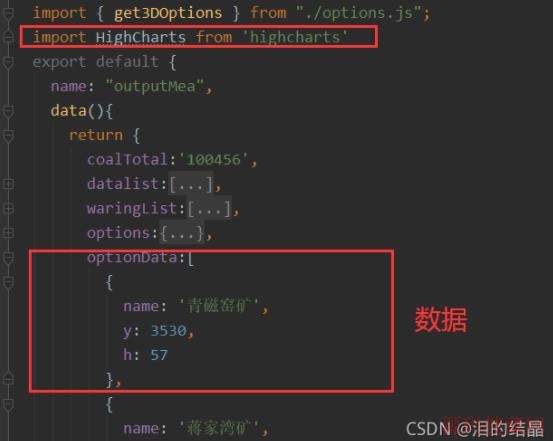
3.页面引入
?init() {
?
? ? ? ? // 修改3d饼图绘制过程
? ? ? ? let each = HighCharts.each,
? ? ? ? ? ? round = Math.round,
? ? ? ? ? ? cos = Math.cos,
? ? ? ? ? ? sin = Math.sin,
? ? ? ? ? ? deg2rad = Math.deg2rad;
? ? ? ? HighCharts.wrap(HighCharts.seriesTypes.pie.prototype, 'translate', function(proceed) {
? ? ? ? ? proceed.apply(this, [].slice.call(arguments, 1));
? ? ? ? ? // Do not do this if the chart is not 3D
? ? ? ? ? if (!this.chart.is3d()) {
? ? ? ? ? ? return;
? ? ? ? ? }
? ? ? ? ? var series = this,
? ? ? ? ? ? ? chart = series.chart,
? ? ? ? ? ? ? options = chart.options,
? ? ? ? ? ? ? seriesOptions = series.options,
? ? ? ? ? ? ? depth = seriesOptions.depth || 0,
? ? ? ? ? ? ? options3d = options.chart.options3d,
? ? ? ? ? ? ? alpha = options3d.alpha,
? ? ? ? ? ? ? beta = options3d.beta,
? ? ? ? ? ? ? z = seriesOptions.stacking ? (seriesOptions.stack || 0) * depth : series._i * depth;
? ? ? ? ? z += depth / 2;
? ? ? ? ? if (seriesOptions.grouping !== false) {
? ? ? ? ? ? z = 0;
? ? ? ? ? }
? ? ? ? ? each(series.data, function(point) {
? ? ? ? ? ? var shapeArgs = point.shapeArgs,
? ? ? ? ? ? ? ? angle;
? ? ? ? ? ? point.shapeType = 'arc3d';
? ? ? ? ? ? var ran = point.options.h;
? ? ? ? ? ? shapeArgs.z = z;
? ? ? ? ? ? shapeArgs.depth = depth * 0.75 + ran;
? ? ? ? ? ? shapeArgs.alpha = alpha;
? ? ? ? ? ? shapeArgs.beta = beta;
? ? ? ? ? ? shapeArgs.center = series.center;
? ? ? ? ? ? shapeArgs.ran = ran;
? ? ? ? ? ? angle = (shapeArgs.end + shapeArgs.start) / 2;
? ? ? ? ? ? point.slicedTranslation = {
? ? ? ? ? ? ? translateX: round(cos(angle) * seriesOptions.slicedOffset * cos(alpha * deg2rad)),
? ? ? ? ? ? ? translateY: round(sin(angle) * seriesOptions.slicedOffset * cos(alpha * deg2rad))
? ? ? ? ? ? };
? ? ? ? ? });
? ? ? ? });
? ? ? ? (function(H) {
? ? ? ? ? H.wrap(HighCharts.SVGRenderer.prototype, 'arc3dPath', function(proceed) {
? ? ? ? ? ? // Run original proceed method
? ? ? ? ? ? var ret = proceed.apply(this, [].slice.call(arguments, 1));
? ? ? ? ? ? console.log(ret);
? ? ? ? ? ? ret.zTop = (ret.zOut + 1) / 100;
? ? ? ? ? ? return ret;
? ? ? ? ? });
? ? ? ? }(HighCharts));
?
? ? ? ? //日总存煤量
? ? ? ? HighCharts.chart('output_3DPerCharts', {
? ? ? ? ? chart: {
? ? ? ? ? ? type: 'pie',
? ? ? ? ? ? backgroundColor:'transparent',
? ? ? ? ? ? events: {
? ? ? ? ? ? ? load: function() {
? ? ? ? ? ? ? ? let each = HighCharts.each, points = this.series[0].points;
? ? ? ? ? ? ? ? each(points, function(p, i) {
? ? ? ? ? ? ? ? ? p.graphic.attr({
? ? ? ? ? ? ? ? ? ? translateY: -p.shapeArgs.ran
? ? ? ? ? ? ? ? ? });
? ? ? ? ? ? ? ? ? p.graphic.side1.attr({
? ? ? ? ? ? ? ? ? ? translateY: -p.shapeArgs.ran
? ? ? ? ? ? ? ? ? });
? ? ? ? ? ? ? ? ? p.graphic.side2.attr({
? ? ? ? ? ? ? ? ? ? translateY: -p.shapeArgs.ran
? ? ? ? ? ? ? ? ? });
? ? ? ? ? ? ? ? });
? ? ? ? ? ? ? }
? ? ? ? ? ? },
? ? ? ? ? ? options3d: {
? ? ? ? ? ? ? enabled: true,
? ? ? ? ? ? ? alpha: 65
? ? ? ? ? ? },
? ? ? ? ? },
? ? ? ? ? title: {
? ? ? ? ? ? text: ''
? ? ? ? ? },
? ? ? ? ? legend: { //图例
? ? ? ? ? ? layout: "horizontal",
? ? ? ? ? ? verticalAlign: "bottom",
? ? ? ? ? ? align: "center",
? ? ? ? ? ? y: 15,
? ? ? ? ? ? x: 0,
? ? ? ? ? ? useHTML: true,
? ? ? ? ? ? symbolWidth: 10,
? ? ? ? ? ? symbolHeight: 10,
? ? ? ? ? ? labelFormatter: function() {
? ? ? ? ? ? ? return ?this.name + '<span style="margin-left: 10px">' + this.y + '</span>吨';
? ? ? ? ? ? },
? ? ? ? ? ? itemStyle:{
? ? ? ? ? ? ? color:'#fff',
? ? ? ? ? ? ? fontSize:'14px',
? ? ? ? ? ? }
? ? ? ? ? },
? ? ? ? ? tooltip:{
? ? ? ? ? ? enabled: false,
? ? ? ? ? },
? ? ? ? ? credits:{
? ? ? ? ? ? enabled: false,
? ? ? ? ? },
? ? ? ? ? plotOptions: {
? ? ? ? ? ? pie: {
? ? ? ? ? ? ? center: ['50%', '68%'],
? ? ? ? ? ? ? size: 250,
? ? ? ? ? ? ? innerSize: 140,
? ? ? ? ? ? ? colors: ['#249ba5','#2765b0','#78c5ef', '#f6c155', '#ef8036', '#be30ff']
? ? ? ? ? ? }
? ? ? ? ? },
? ? ? ? ? series: [
? ? ? ? ? ? {
? ? ? ? ? ? ? name:'青磁窑矿',
? ? ? ? ? ? ? data:this.optionData,
? ? ? ? ? ? ? showInLegend: true,
? ? ? ? ? ? ? dataLabels: {
? ? ? ? ? ? ? ? padding: -10,
? ? ? ? ? ? ? ? shadow: true,
? ? ? ? ? ? ? ? style: {
? ? ? ? ? ? ? ? ? fontWeight: 'bold',
? ? ? ? ? ? ? ? ? fontSize:'14px',
? ? ? ? ? ? ? ? ? color: "#fff",
? ? ? ? ? ? ? ? ? textOutline:'1px 1px transparent',
? ? ? ? ? ? ? ? },
? ? ? ? ? ? ? ? formatter: function() {
? ? ? ? ? ? ? ? ? return ?this.key + '<br/>' + '<p style="color:#00afff">' + (this.y / this.total * 100).toFixed(2) + '%</p>';
? ? ? ? ? ? ? ? },
? ? ? ? ? ? ? },
? ? ? ? ? ? }
? ? ? ? ? ]
? ? ? ? })
? ? ? },
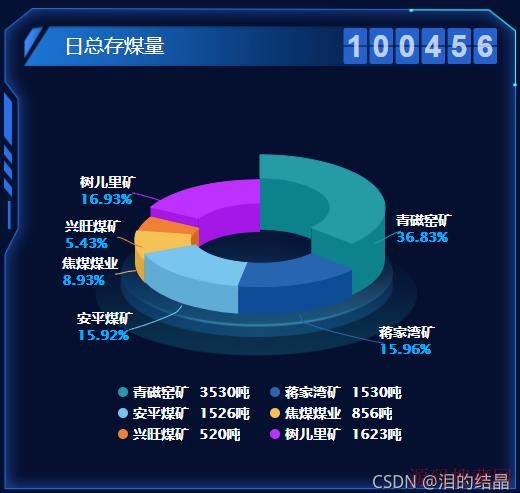
4.最终实现效果
以上就是本文的全部内容,希望对大家的学习有所帮助,也希望大家多多支持源码搜藏网。